Explore profiles
Every profile CubeAPM receives, from any source, shows up on the Profiles page. This page explains how to find the profile you need and how to read it.
The Profiles page
Open Profiles from the left navigation.
- Environment and time range. The pickers at the top work like on the other pages.
- Filter rail. On the left, pick values for
service,profile.source(datadog,newrelic,opentelemetry),profile.runtimeandprofile.type. The counts next to each value show how many profiles you would get. - Search bar. Each pick in the rail writes a clause into the search bar, for example
service:="checkout" profile.type:="cpu". You can also type a query yourself and press Enter. Other fields you can search on includeenv,host.name,version,profile.format,profile.runtime_versionandprofile.profiler_version. Recent searches are kept in the drop-down inside the search bar. - Timeline. The chart under the search bar shows how many profiles there are over time, by profile time.
- List. Each row is one profile: time, service, source, runtime, type, host, number of samples and size. Click a row to open it.
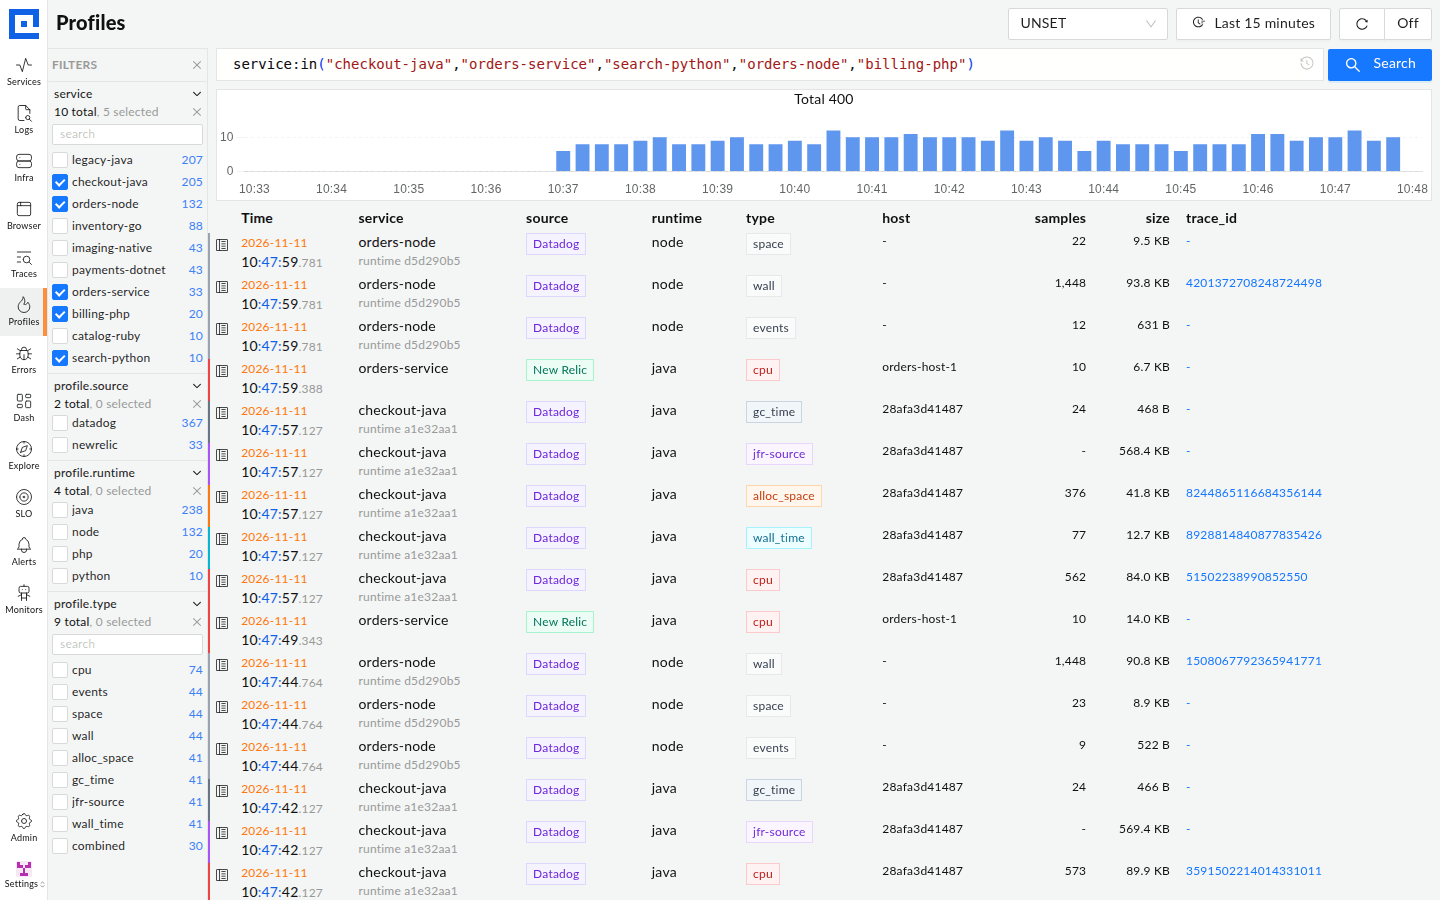
One upload from an agent can produce several rows, one per profile type. For example, a Datadog Java upload gives cpu, alloc_space, wall_time and gc_time rows. Python, PHP, Ruby, .NET and native Datadog profiles come as one combined row that holds all their types.
Reading a profile
The top of a profile shows its service, env, host, runtime, agent, time and number of samples and, where the source sends them, the process id, container id and runtime id. Below that, a small chart shows samples per minute for the same service, env and profile type, with a marker on the open profile. Click a point to open the profile with the most samples in that minute.
Sample type
Most profiles hold more than one kind of measurement, for example CPU time, wall time and allocations. Pick one in the sample-type selector, which also shows its unit (count, nanoseconds or bytes). The flame graph and every table on the page follow it. A profile opens on the type its profiler marks as the default. Without one, CubeAPM picks a CPU or wall-time type that has data, or else another type that has data.
Flame
The flame graph shows every stack the profiler sampled. The root is at the bottom and each row above a frame holds the functions it called. The width of a frame is its share of the total for the selected sample type.
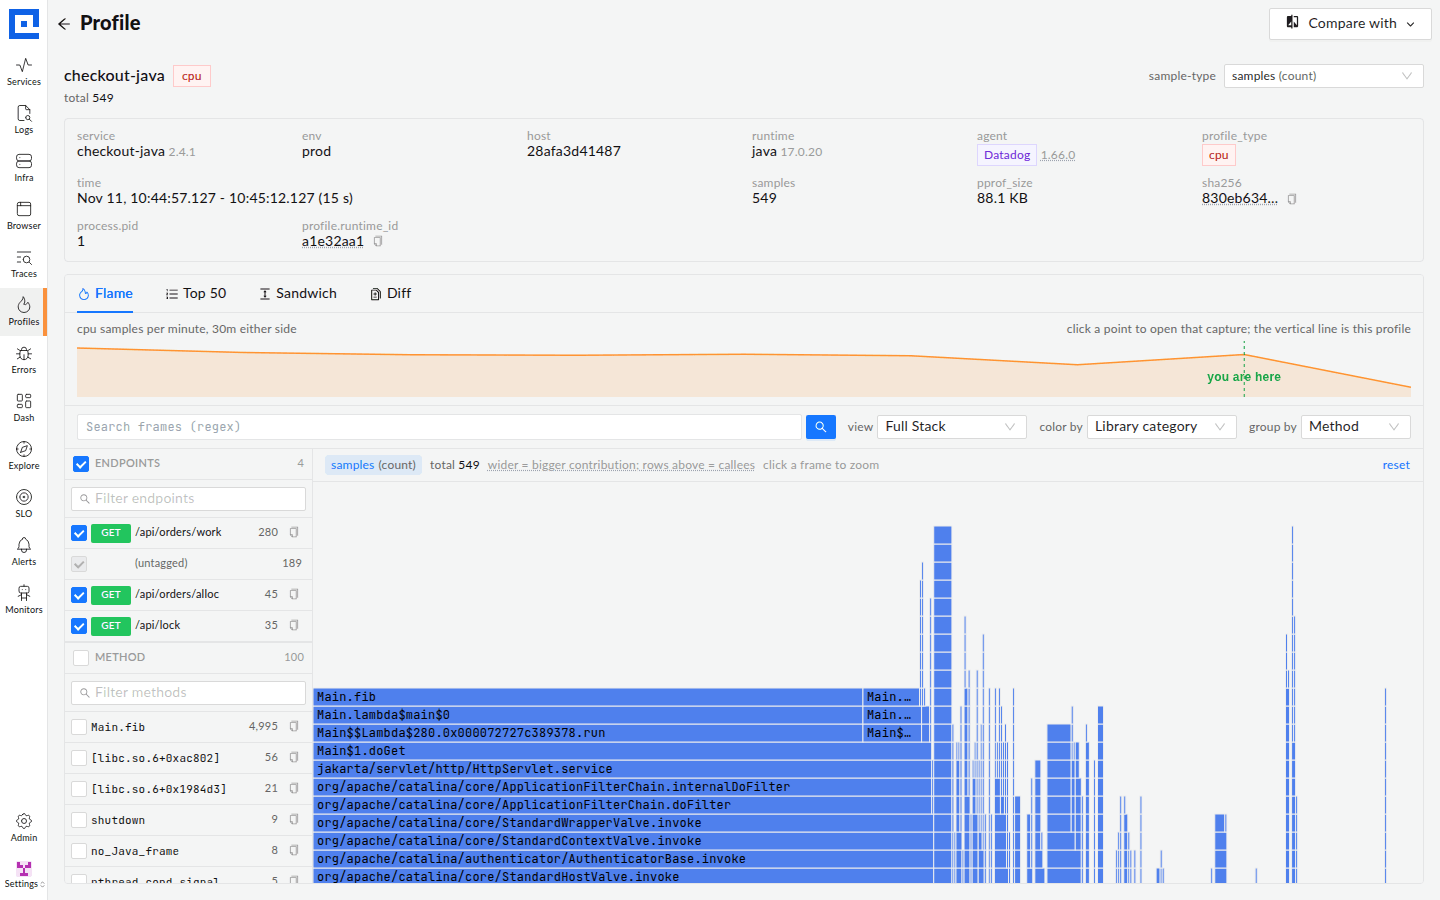
- Click a frame to zoom into it. reset goes back to the full view.
- Search frames (regex) marks the frames that match, for example
OrderService|checkout, and shows how many match. - view (Full Stack, Only My Code, Libraries, Infrastructure) dims the frames outside the chosen category, so the rest stands out.
- color by colours frames by library category, by value (heat map) or by function name.
- group by merges frames by method, class or package.
Top 50
The 50 functions with the highest self value for the selected sample type. self counts only the function itself, total also includes everything it called. Click a column header to sort these 50 rows. A function that appears more than once on the same stack, such as a recursive function, counts once per appearance in total, so its total % can go above 100%.
Sandwich
Pick a function in focus function (it lists the Top 50 functions) to see, above it, the paths that called it and, below it, what it called. Use this when a function is called from many places and its time is spread across the flame graph.
Endpoints and methods
On the left of the flame graph:
- Endpoints (Datadog profiles) lists the HTTP routes the samples belong to, for example
GET /api/orders, with their share. Tick one or more to limit the flame graph and tables to those requests. Samples taken outside a request have no endpoint. - Method lists the hottest methods. Pick one to highlight it.
- Allocated Type (Datadog Java allocation profiles) lists the classes that were allocated the most bytes.
Diff
Compares two profiles. Open it with Compare with at the top right of a profile:
- 1 hour ago, Yesterday, same time or Last week, same time: CubeAPM picks a profile of the same service and type from around that time as the baseline, and the open profile is the head;
- Pick another record manually: the open profile is the baseline, and you pick the head.
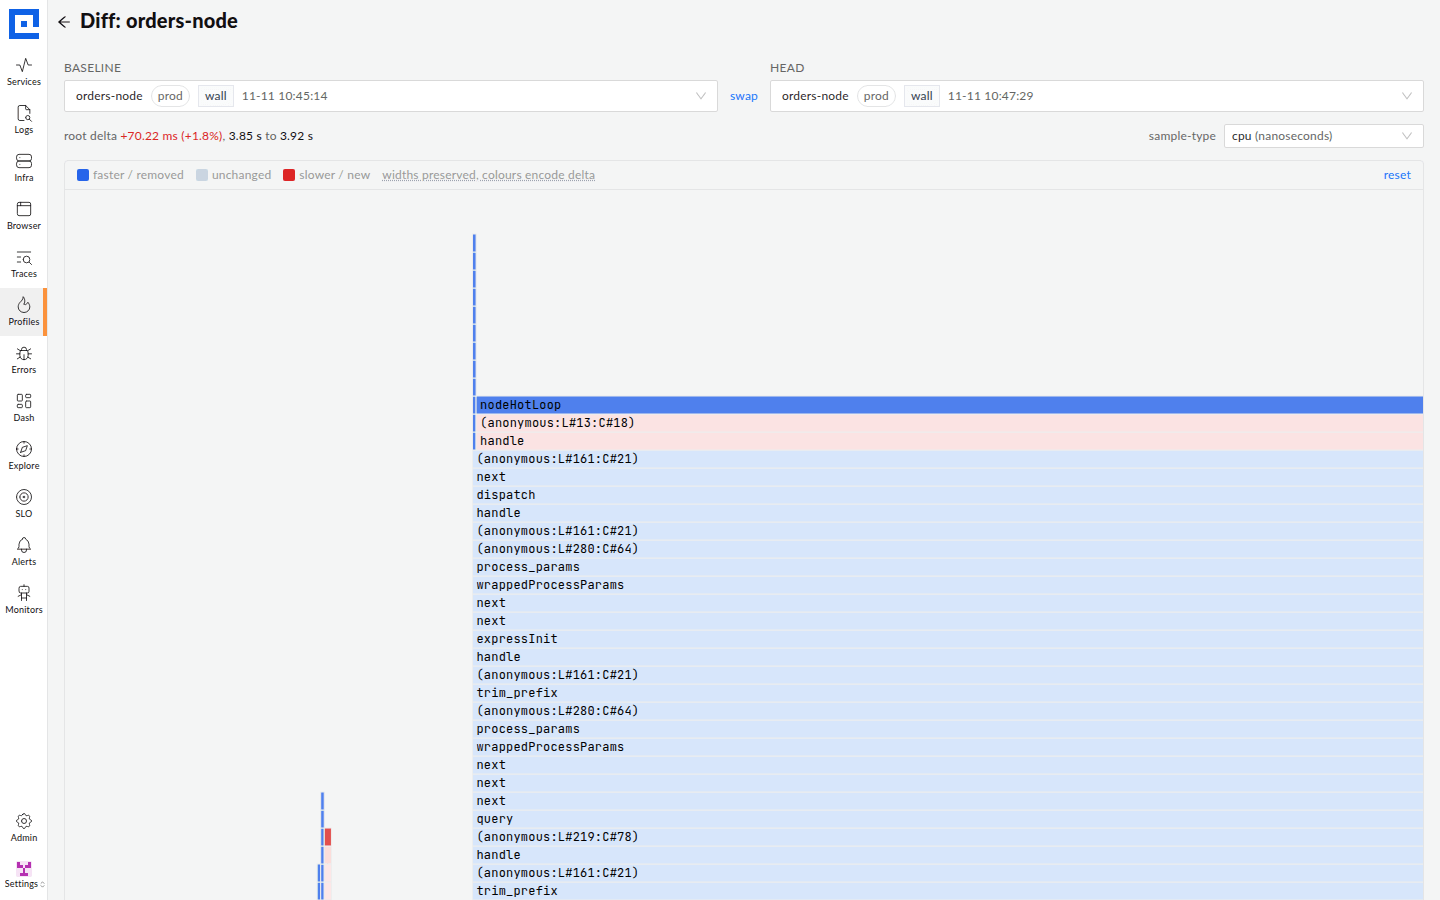
The diff page shows the baseline and the head profile at the top (pick another one in either box, or swap them), the change in the total, and a flame graph whose colours show the change: red for slower or new, blue for faster or removed. The diff compares the raw values of the two profiles. It does not adjust for a longer recording or more traffic, so check that both profiles cover similar load before you read a red frame as a slowdown. Use it after a deploy, or to compare a slow period with a normal one.
JVM Health (New Relic)
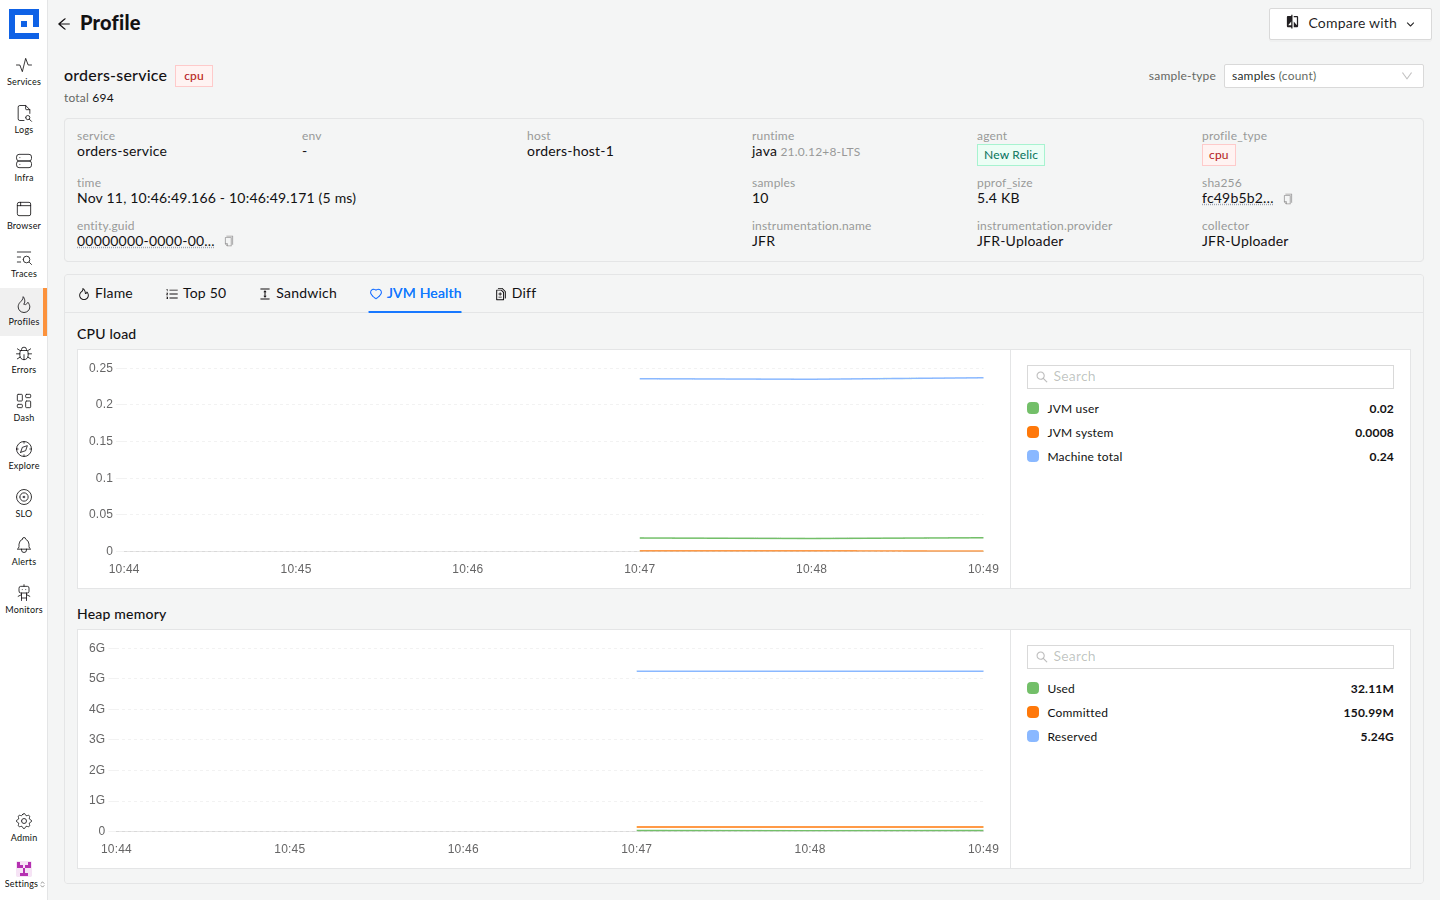
New Relic Java profiles have a JVM Health tab with charts for CPU load, heap memory, garbage collection, thread allocation, metaspace and thread context switches. The charts cover the time range picked on the Profiles page, not only the profile's own time. To change it, go back to the Profiles page, change the time range and open the profile again. For a JVM that started a few minutes ago, the last 5 minutes shows its lines best. See New Relic Java.
From a trace to its profiles
Datadog profiles carry the ids of the spans that were running when each sample was taken. That lets you go from a slow request to the code that made it slow:
- Open a trace and select the Profiles tab.
- The tab lists the profiles that have samples from this trace: service, env, profile type, samples, duration and time.
- Click a row to open the profile in a new tab. The profile opens whole: it covers every request and background task in that recording, not only this trace. Its sample count on the tab is for the whole recording too.
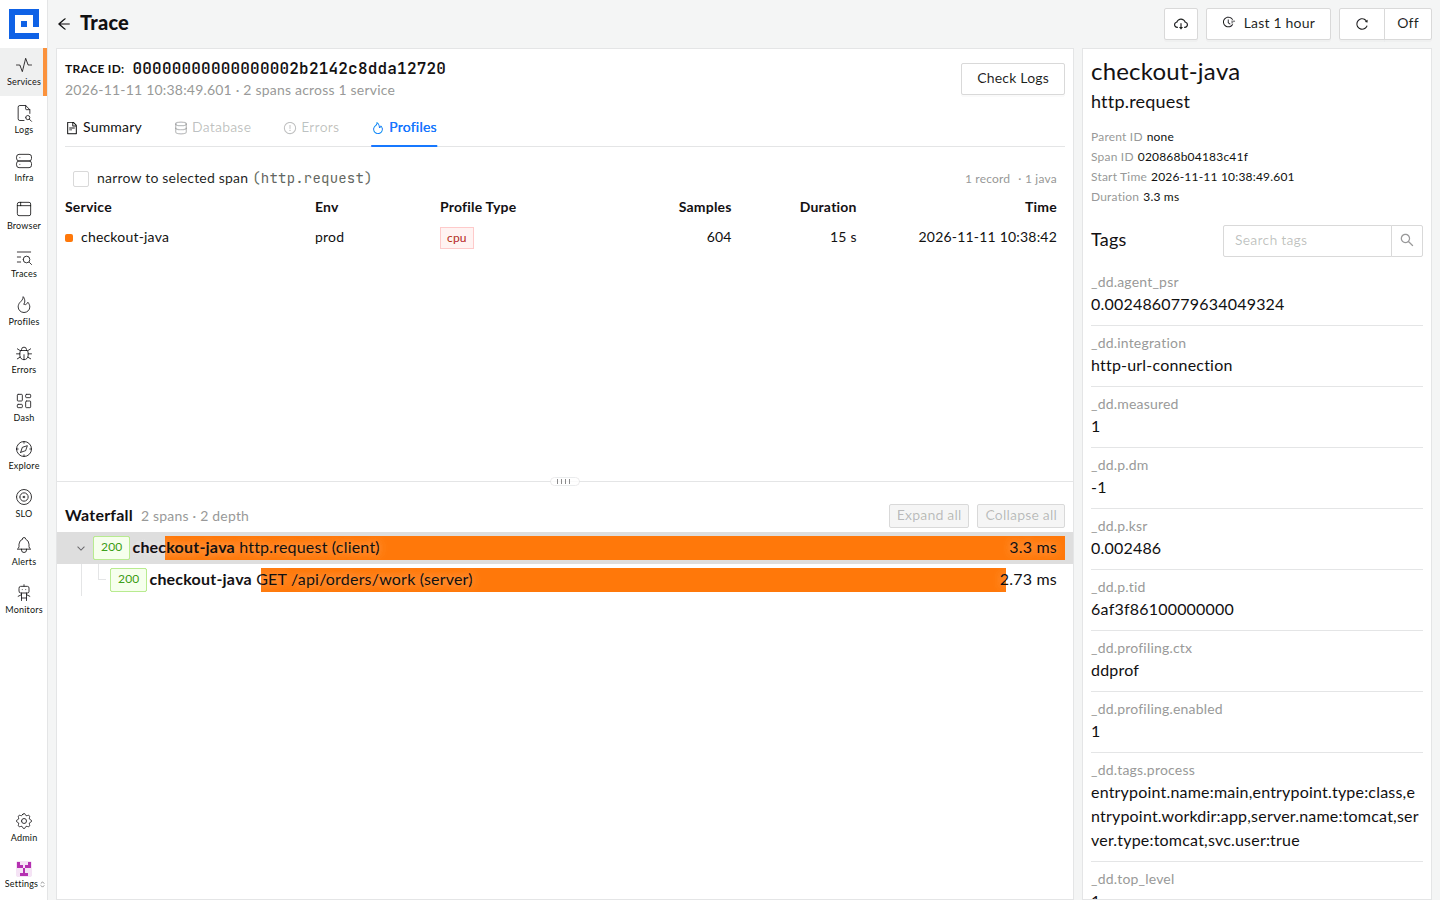
The tab starts narrowed to the selected span (narrow to selected span). If the work ran in a child span, it shows No profile records overlap this span. Click widen to the whole trace, or select the child span in the waterfall.
A request shows up only if the profiler took a sample while it ran. Requests that take tens of milliseconds or more usually have one. Many very short requests, of a few milliseconds, have none.
New Relic and OpenTelemetry profiles carry no span ids, so they do not show on this tab.
Profiles with no flame graph
A Datadog Java upload also stores a jfr-source row: the original JFR recording, kept as it arrived. It has no flame graph of its own. Open the cpu, alloc_space, wall_time, gc_time or lock_time row from the same upload instead.